Solar Potential Map
Effectively promote the energy transition in your municipality: with a solar potential map. Citizens, homeowners and tradespeople can see the solar potential of the analyzed roof areas at a glance. Meaningful data and evaluations support you in your public relations work or at information events.
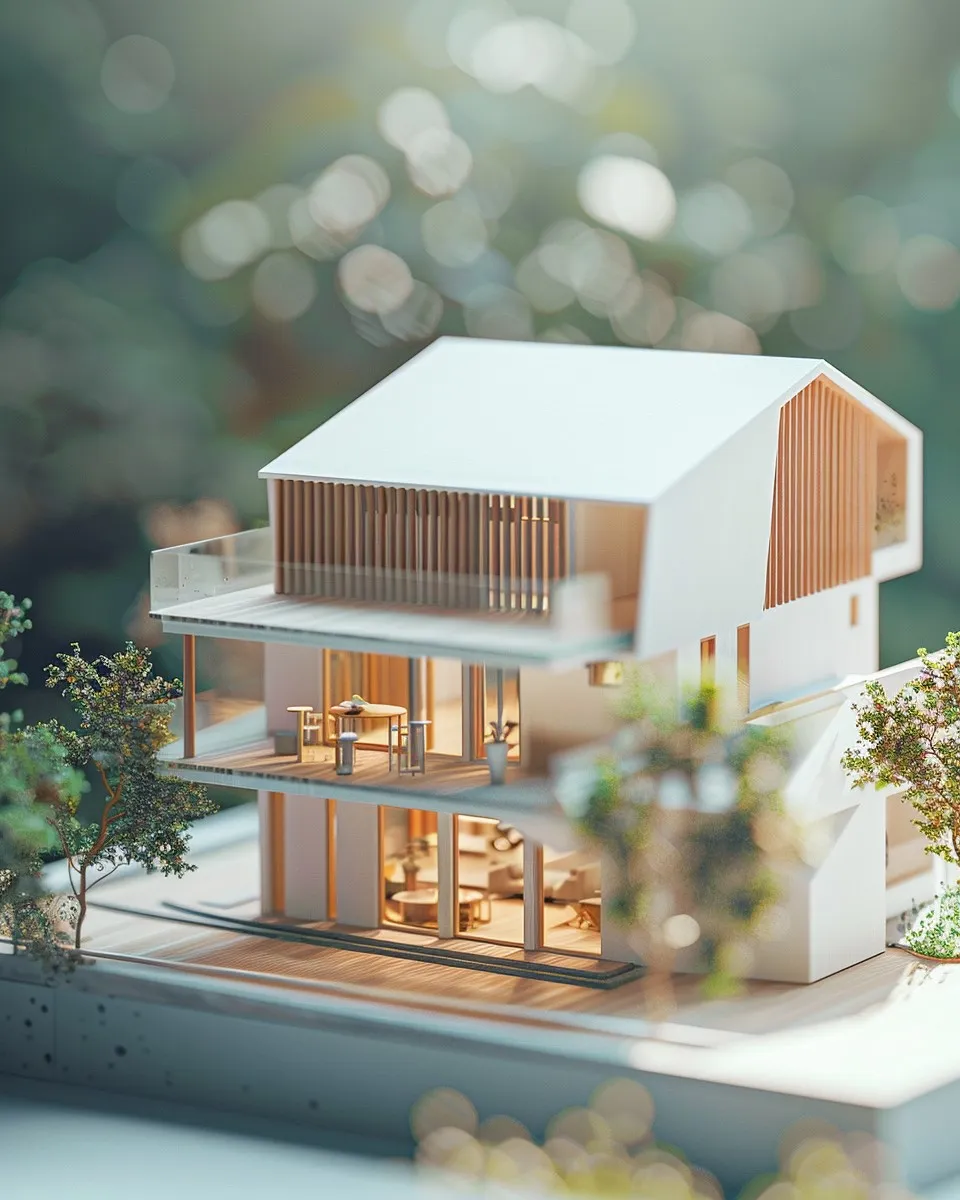
The individual building analysis includes, among other things, local weather data, possible shading on the roof surfaces and any disruptive roof structures. The solar potential map allows you to individually analyze yield and demand.
Users benefit from this
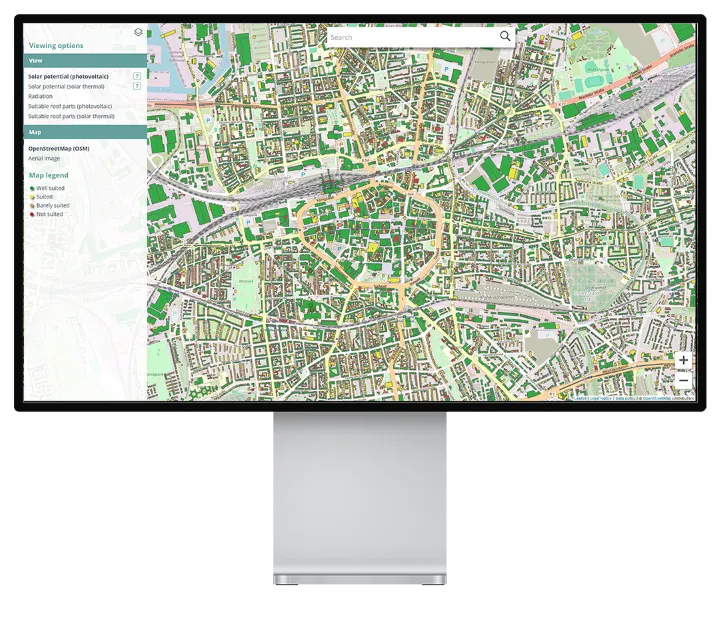
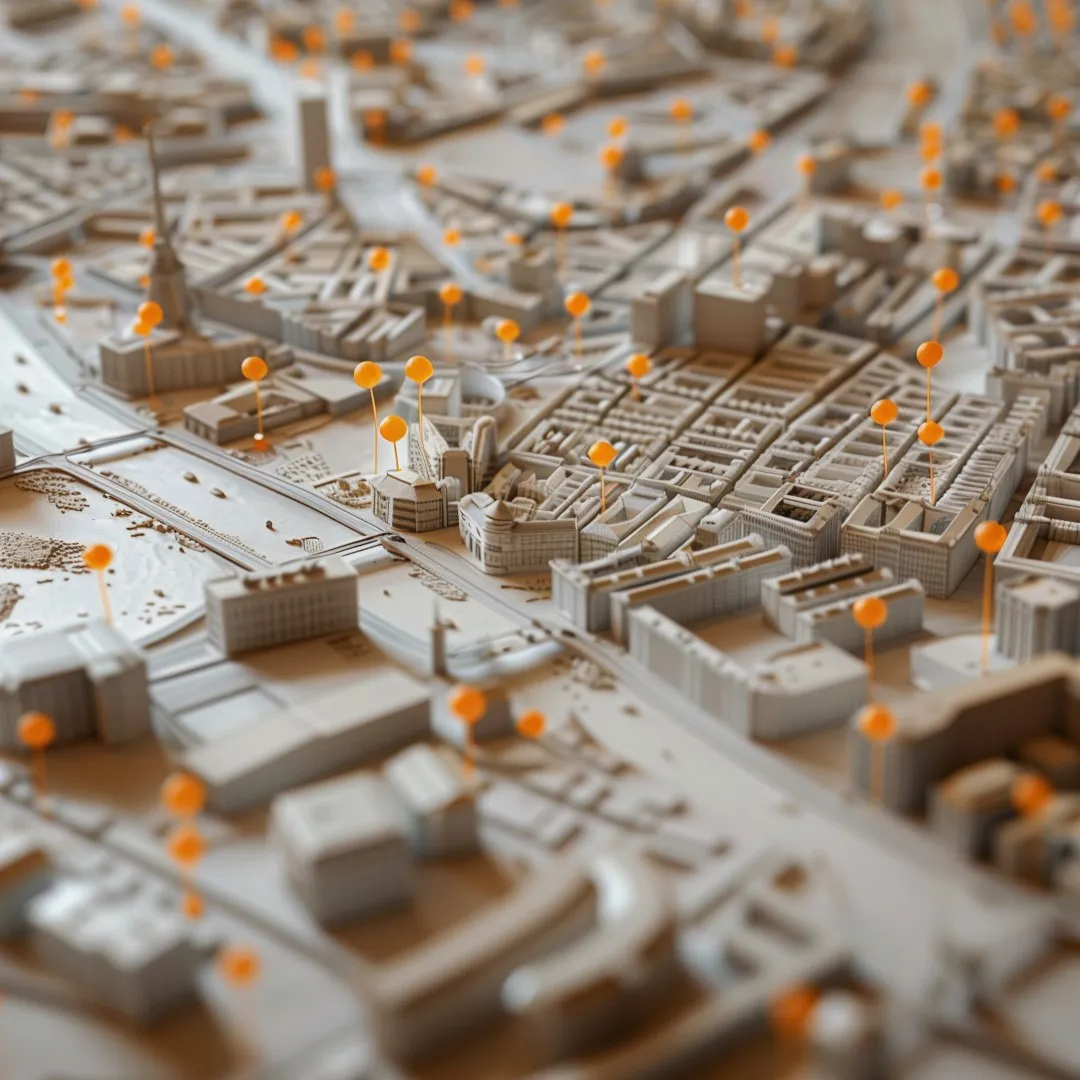
The interactive maps show the possible potential.
They show the suitability of buildings for the use of solar energy in an urban area.
They show the suitability of the roof surface for photovoltaics and solar thermal energy in different color-coded suitability levels.
They clearly illustrate the usable solar irradiation and shading on the roof surfaces.
They present a detailed representation of the roof areas suitable for the installation of the systems.
How does the solar potential map work?
This allows your users to plan an optimal solar system
The customer journey is intuitive, supporting the individual configuration of a solar system. Average values are sufficient, making extensive technical knowledge unnecessary. The calculation is possible for both private and commercial properties. Combining solar thermal energy, photovoltaics, and electricity storage is very simple. Individual load profiling allows for the inclusion of additional electricity consumers like electric vehicles or heat pumps in the system simulation. The effects of an electricity storage system on monthly and daily levels, as well as on self-sufficiency and self-consumption, are calculated. Dynamic module prices are integrated, and there is a choice between full and surplus feed-in. The economic efficiency and amortization period for both credit and self-financing can be calculated. Creating an individual overview in PDF format for optimal roof use is easy.
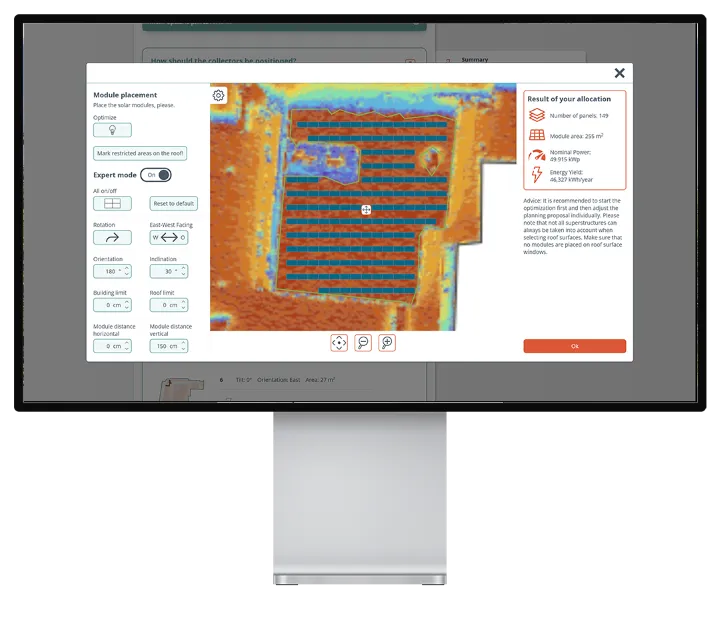
What the module placer does
- A good basis for detailed advice from a tradesman.
- Photovoltaic modules as well as solar thermal collectors can be placed on a roof surface and the system can thus be adapted to individual needs and requirements.
- Individual adjustment of the size dimensions and performance parameters as well as alignment of the planned system.
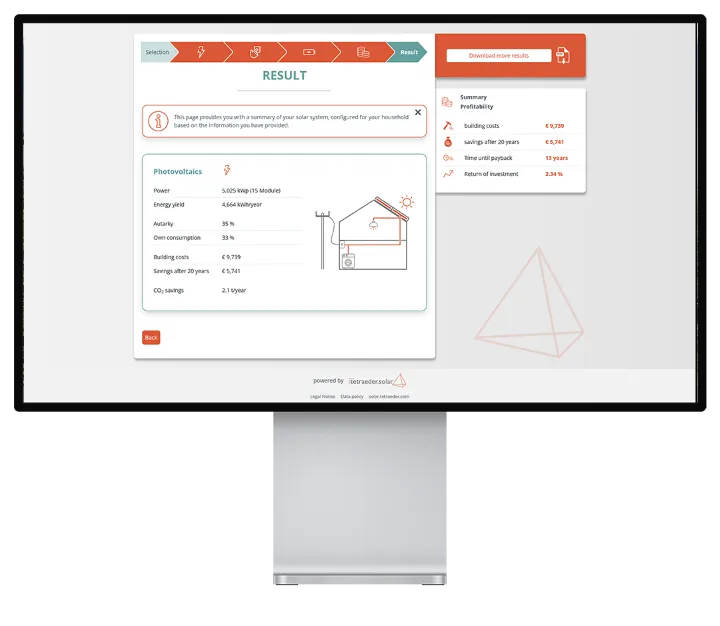
What the profitability calculator does
- Detailed statements on the economic efficiency of the system
- Calculation of independence, amortization and return on investment
- Precise results thanks to the inclusion of essential calculation parameters
- Continuous adjustment of framework conditions such as electricity prices or changes in feed-in tariffs
Our technology for more solar potential
Three-dimensional surface models can be processed automatically and together with the data from the public authorities using software developed by us.
Häufig gestellte Fragen
Das Solarpotenzialkataster zeigt, welche Potenziale für die Nutzung von Photovoltaik und Solarthermie in einem bestimmten räumlichen Gebiet vorhanden sind. Die Angaben sind dabei individuell auf jedes Gebäude zugeschnitten. Dadurch können Sie auf einen Blick abschätzen, ob die Erzeugung von klimafreundlicher Energie aus Sonnenlicht auf Ihrem Dach lohnenswert sein könnte oder nicht. Neben der grundsätzlichen Eignung eines Gebäudes werden auch die spezifischen Teile der Dachflächen angezeigt, die sich besonders für die Installation einer Photovoltaik- oder Solarthermieanlage empfehlen. Darüber hinaus wird die Einstrahlungsintensität der Sonne detailliert für das gesamte Dach dargestellt.
Mithilfe einer Photovoltaikanlage erzeugen Sie Strom aus Sonnenlicht. Eine Solarthermieanlage dient dazu, mit Hilfe der Sonne Warmwasser und Heizwärme zu erzeugen. Im Vergleich zu den Solarmodulen, aus denen sich eine Photovoltaikanlage zusammensetzt, benötigen die Kollektoren der Solarthermieanlage deutlich weniger Platz. Im Einzelfall kann dies dazu führen, dass sich Dächer zwar nur bedingt für Photovoltaik eignen, jedoch gut für Solarthermie genutzt werden können. Ein Dach, das sich gut für Photovoltaik eignet, eignet sich immer auch gut für Solarthermie.
Das geht und macht Sinn! Schließlich wird ja im Gebäude sowohl Strom als auch Wärme benötigt. Aufgrund der kleinen Kollektorfläche, die für die Solarthermie benötigt wird, könnte die restliche verfügbare Fläche für Photovoltaik-Module genutzt werden. Eine geteilte Flächennutzung ist eine Überlegung wert. Ob eine gleichzeitige Umsetzung möglich ist oder ob beides angestrebt wird, muss im Einzelfall entschieden werden. Darüber hinaus ist eine Kombination der Nutzung der Dachflächen für eine Dachbegrünung und die Gewinnung von Solarenergie möglich!
Grundlage für die Solarpotenzialanalyse sind Laserscandaten, die beim Überfliegen des jeweiligen Untersuchungsgebietes generiert wurden. Aus diesen Informationen wird ein vereinfachtes Modell der Häuser und der umgebenden Objekte (z.B. Bäume) erstellt. Im nächsten Schritt werden die Dachflächen automatisch erkannt. Einstrahlung und Verschattung werden berechnet. Stark verschattete Bereiche werden als nicht geeignet identifiziert. Für die übrigen Dachflächen wird die Einstrahlung für den Verlauf eines ganzen Jahres bestimmt. Einstrahlung ist nicht gleich Ertrag: Der Wirkungsgrad (die Fähigkeit der Module, solare Einstrahlung in elektrischen Strom umzuwandeln) und die Beschaffenheit der verwendeten Bauteile bestimmen die gewonnene Menge elektrischer Energie und somit auch den möglichen finanziellen Ertrag einer PV-Anlage.
Da die Einstrahlung je nach Region sehr unterschiedlich sein kann, nutzen wir für jeden Standort die wissenschaftlich validierten Modellergebnisse von PV-GIS. Diese werden vom Joint Research Centre der EU erstellt, gepflegt und veröffentlicht.
Die Qualität der Aussage des Solarpotenzialkatasters hängt von den verfügbaren Laserscandaten ab. Je höher die Datenqualität ist, desto mehr Dachaufbauten werden in der Berechnung berücksichtigt. Gebäude, deren Datengrundlage keine Aussage über Dachaufbauten zulassen, sind gesondert gekennzeichnet. Da es sich um ein automatisiertes Verfahren handelt, sind Abweichungen von der realen Dachstruktur möglich. Oft lassen sich bestehende kleinere Aufbauten auf dem Dach aber so verändern, dass die Solarnutzung möglich wird.
Nein, Dachüberhänge werden nicht berücksichtigt, da diese nicht in den Katasterdaten enthalten sind. Gebäude werden immer aus den Katasterdaten entnommen, da ansonsten z.B. bei Reihenhäusern keine Abgrenzung möglich ist.
Die Abkürzung kWp bedeutet „Kilowatt-Peak“ und ist als Leistungsmaß zu verstehen. In Kilo-watt-Peak wird die maximale Leistung angegeben, auch Nennleistung genannt, die eine Solaranlage erbringen kann. In der Realität kann der Kilowatt-Peak nur unter optimalen Bedingungen erreicht werden, sodass eine Solaranlage den Großteil des Jahres eine geringere Leistung erzeugt. Unter kWh versteht man „Kilowattstunde“, was eine Maßeinheit für Energie darstellt. Somit ist sie gleichbedeutend mit dem Ertrag. Eine Kilowattstunde entspricht der Energie, die eine Solaranlage mit einer Nennleistung von 1 kWp unter optimalen Bedingungen innerhalb von einer Stunde erzeugen kann.
Um mehr Informationen darüber zu erhalten, warum ein Gebäude bspw. "gut geeignet" für Photovoltaik oder Solarthermie ist, klicken Sie am linken Bildrand "Anzeige" auf das kleine weiße "i" im grauen Kreis neben den Schaltflächen "Solarpotenzial (Photovoltaik)" bzw. "Solarpotenzial (Thermie)". Das sich öffnende Fenster beschreibt Ihnen detailliert, welche Eigenschaften den jeweiligen Stunden zugeschrieben werden. Unter kWh versteht man „Kilowattstunde“, was eine Maßeinheit für Energie darstellt. Somit ist sie gleichbedeutend mit dem Ertrag. Eine Kilowattstunde entspricht der Energie, die eine Solaranlage mit einer Nennleistung von 1 kWp unter optimalen Bedingungen innerhalb von einer Stunde erzeugen kann.
Dies kann vielerlei Gründe haben und zum Beispiel an der Transformation von Daten oder Ungenauigkeit der Basiskarte (im besonderen OpenStreetMap) liegen. Die Berechnung der Eignung wird auf Grundlage von amtlichen Daten mit der amtlichen Genauigkeit durchgeführt.
Dies könnte an der Position Ihres gewählten Kartenausschnitts liegen. Das Solarpotenzialkataster ist auf den räumlichen Bereich des jeweiligen Herausgebers begrenzt, beispielsweise auf einen Landkreis. Die Hintergrundkarte "OpenStreetMap(OSM)" zeigt u.a. die relevanten Grenzverläufe.
Dabei handelt es sich möglicherweise um Gebäude, die zum Zeitpunkt der Befliegung des Untersuchungsgebiets noch nicht existierten oder sich gerade im Bau befanden. Eine solche Befliegung ist essentiell, um die geeigneten Laserscandaten für die Berechnung des Katasters zu erhalten. Da es sich um ein automatisiertes Verfahren handelt, kann es im Einzelfall vorkommen, dass für im Nachhinein fertiggestellte Gebäude keine Angaben vorliegen. Im Umkehrschluss ist es dementsprechend möglich, dass das Kataster Eignungen für Gebäude ausweist, die bereits nicht mehr oder nur noch teilweise existieren.
Rufe einfach über den Web-Browser die Seite erneut auf.
Sollten sich die eingefärbten Gebäude nicht mit der Hintergrundkarte decken, kann dies folgende Ursachen haben:
- Die hinterlegten Luftbilder sind schräg von oben aufgenommen und zeigen daher ein verzerrtes Dach.
- Hintergrundkarten von Google oder OpenStreetMap verwenden nicht die korrekt eingemessenen amtlichen Katasterdaten, welche bei der Berechnung des Solarpotenzials verwendet werden.
Es kann vorkommen, dass im Solarpotenzialkataster statt der gewählten Karte nur ein hellroter Hintergrund angezeigt wird. Dies kann mehrere Gründe haben:
- Für den angezeigten Ausschnitt liegt kein Kartenmaterial des gewünschten Typs vor.
- Das Kartenmaterial ist in der gewählten Zoom-Stufe nicht vorhanden.
- Auf das Kartenmaterial kann vorübergehend nicht zugegriffen werden.
Auf Kosten der Ausgaben stehen neben einmaligen Baukosten laufende Kosten für Wartung und Versicherung. Bei Kreditfinanzierung fallen zusätzlich Zinskosten an. Auf der Einnahmenseite stehen einerseits Vergütungen für in das Stromnetz eingespeister Strom. Andererseits entstehen Einsparungen durch verminderten Strombezug, was den Großteil der Einnahmen ausmacht. Zur Bestimmung der selbst direkt verbrauchten Strommenge wird die Kurve der Stromerzeugung und das Lastprofil der angeschlossenen Verbraucher verrechnet.
Interested?
If you would like to find out more about our solar potential map and are interested in working with us, please contact us! We look forward to shaping the future of sustainable energy supply together with you.

Frequently asked questions
The solar potential register shows the potential for the use of photovoltaics and solar thermal energy in a specific geographical area. The information is individually tailored to each building. This allows you to assess at a glance whether generating climate-friendly energy from sunlight on your roof could be worthwhile or not.
In addition to the basic suitability of a building, the specific parts of the roof areas that are particularly recommended for the installation of a photovoltaic or solar thermal system are also displayed. In addition, the solar radiation intensity is shown in detail for the entire roof.
A photovoltaic system is used to generate electricity from sunlight. A solar thermal system uses the sun to generate hot water and heating. Compared to the solar modules that make up a photovoltaic system, the collectors of a solar thermal system require significantly less space. In individual cases, this can mean that roofs are only suitable for photovoltaics to a limited extent, but can be used well for solar thermal energy. A roof that is well suited for photovoltaics is always also well suited for solar thermal energy.
That is possible and makes sense! After all, both electricity and heat are needed in the building. Due to the small collector area required for solar thermal energy, the remaining available area could be used for photovoltaic modules. Shared use of the area is worth considering. Whether simultaneous implementation is possible or whether both should be pursued must be decided on a case-by-case basis.
It is also possible to combine the use of roof areas for green roofs and the generation of solar energy!
The solar potential analysis is based on laser scan data generated by flying over the area under investigation. This information is used to create a simplified model of the houses and surrounding objects (e.g. trees). In the next step, the roof surfaces are automatically recognized. Irradiation and shading are calculated. Heavily shaded areas are identified as unsuitable. For the remaining roof areas, the irradiation is determined for the course of an entire year. Irradiation is not the same as yield: the efficiency, i.e. the ability of the modules to convert solar radiation into electricity, and the quality of the components used determine the amount of electrical energy generated and therefore also the potential financial yield of a PV system.
As irradiation can vary greatly depending on the region, we use the scientifically validated model results from PV-GIS for each location. These are created, maintained and published by the Joint Research Center of the EU.
The quality of the information provided by the solar potential register depends on the laser scan data available. The higher the data quality, the more roof structures are taken into account in the calculation. Buildings whose data basis does not allow a statement to be made about roof structures are marked separately. As this is an automated process, deviations from the actual roof structure are possible. However, existing smaller roof structures can often be modified in such a way that solar use is possible.
No, roof overhangs are not taken into account as they are not included in the cadastral data. Buildings are always taken from the cadastral data, as otherwise it is not possible to delimit terraced houses, for example.
The abbreviation kWp means "kilowatt peak" and is to be understood as a measure of power. Kilowatt peak is the maximum output, also known as nominal output, that a solar installation can produce. In reality, the kilowatt peak can only be achieved under optimum conditions, meaning that a solar system generates a lower output for most of the year.
kWh means "kilowatt hour", which is a unit of measurement for energy. It is therefore synonymous with yield. One kilowatt hour corresponds to the energy that a solar system with a nominal output of 1 kWp can generate within one hour under optimum conditions.
To find out more about why a building is "well suited" for photovoltaics or solar thermal energy, click on the small white "i" in the gray circle next to the "Solar potential (photovoltaics)" or "Solar potential (thermal)" buttons on the left-hand side of the "Display" screen. The window that opens describes in detail which properties are attributed to the respective hours.
There can be many reasons for this, such as the transformation of data or inaccuracy of the base map (in particular OpenStreetMap). The calculation of suitability is carried out on the basis of official data with official accuracy.
This could be due to the position of your selected map section. The solar potential register is limited to the spatial area of the respective publisher, for example to a district. The background map "OpenStreetMap (OSM)" also shows the relevant boundaries.
These may be buildings that did not yet exist or were under construction at the time the survey area was flown over. Such an aerial survey is essential in order to obtain suitable laser scan data for calculating the cadastre. As this is an automated process, it can happen in individual cases that no data is available for buildings that were completed at a later date. Conversely, it is therefore possible that the cadastre will show suitability for buildings that no longer exist or only partially exist.
Simply call up the page again via the web browser.
If the colored buildings do not match the background map, this may have the following causes:
- the stored aerial images are taken at an angle from above and therefore show a distorted roof.
- background maps from Google or OpenStreetMap do not use the correctly measured official cadastral data, which is used to calculate the solar potential.
It can happen that only a light red background is displayed in the solar potential cadastre instead of the selected map. There may be several reasons for this:
- no map material of the desired type is available for the displayed section.
- the map material is not available at the selected zoom level.
- the map material cannot be accessed temporarily.
In addition to one-off construction costs, there are ongoing costs for maintenance and insurance. In the case of credit financing, there are also interest costs. On the income side, on the one hand there are payments for electricity fed into the grid. On the other hand, savings are made through reduced electricity consumption, which accounts for the majority of income. The electricity generation curve and the load profile of the connected consumers are used to determine the amount of electricity consumed directly by the customer.
Discover more Products


Get in touch for a greener future
Do you have questions about our products, want to explore partnership opportunities or simply learn more about how enwarp can support your renewable energy initiatives? Our team of experts is ready to support you every step of the way.